VisualQuery 3: Debugging
In 2sxc 11.13 we're introducing VisualQuery 3 with two new feature to help you create VisualQueries
- Stream Debugging
- Non-Breaking Errors
Stream Debugging
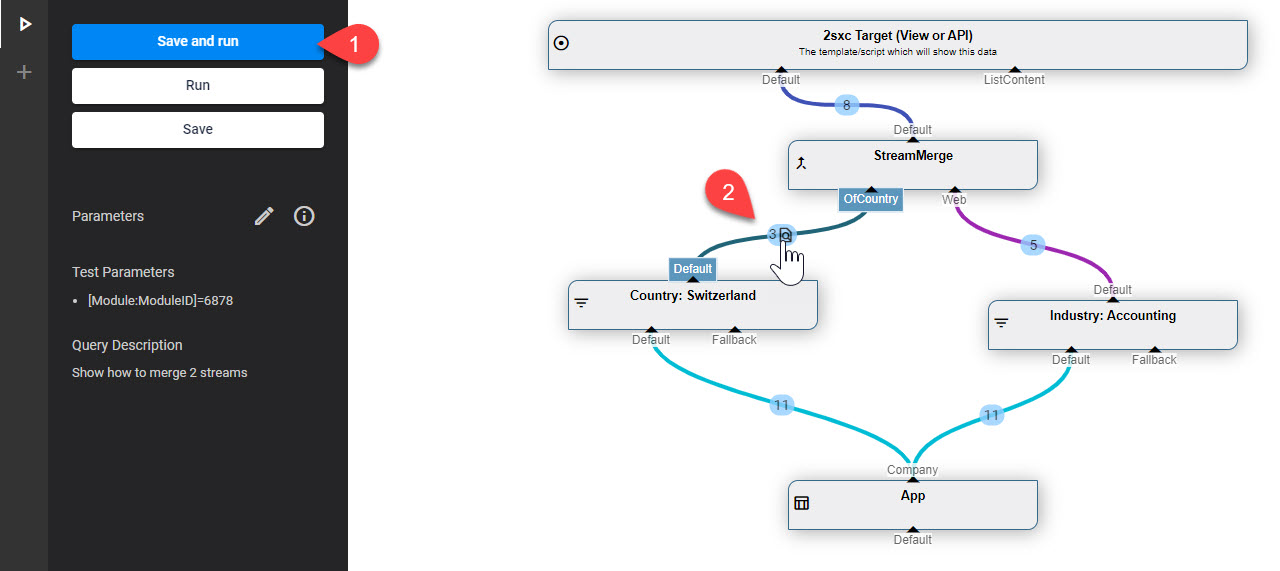
After running a query and closing the result-preview, you'll see how many items were on each stream. In VisualQuery 3 you can now click on that stream to see exactly what was contained in the stream itself.
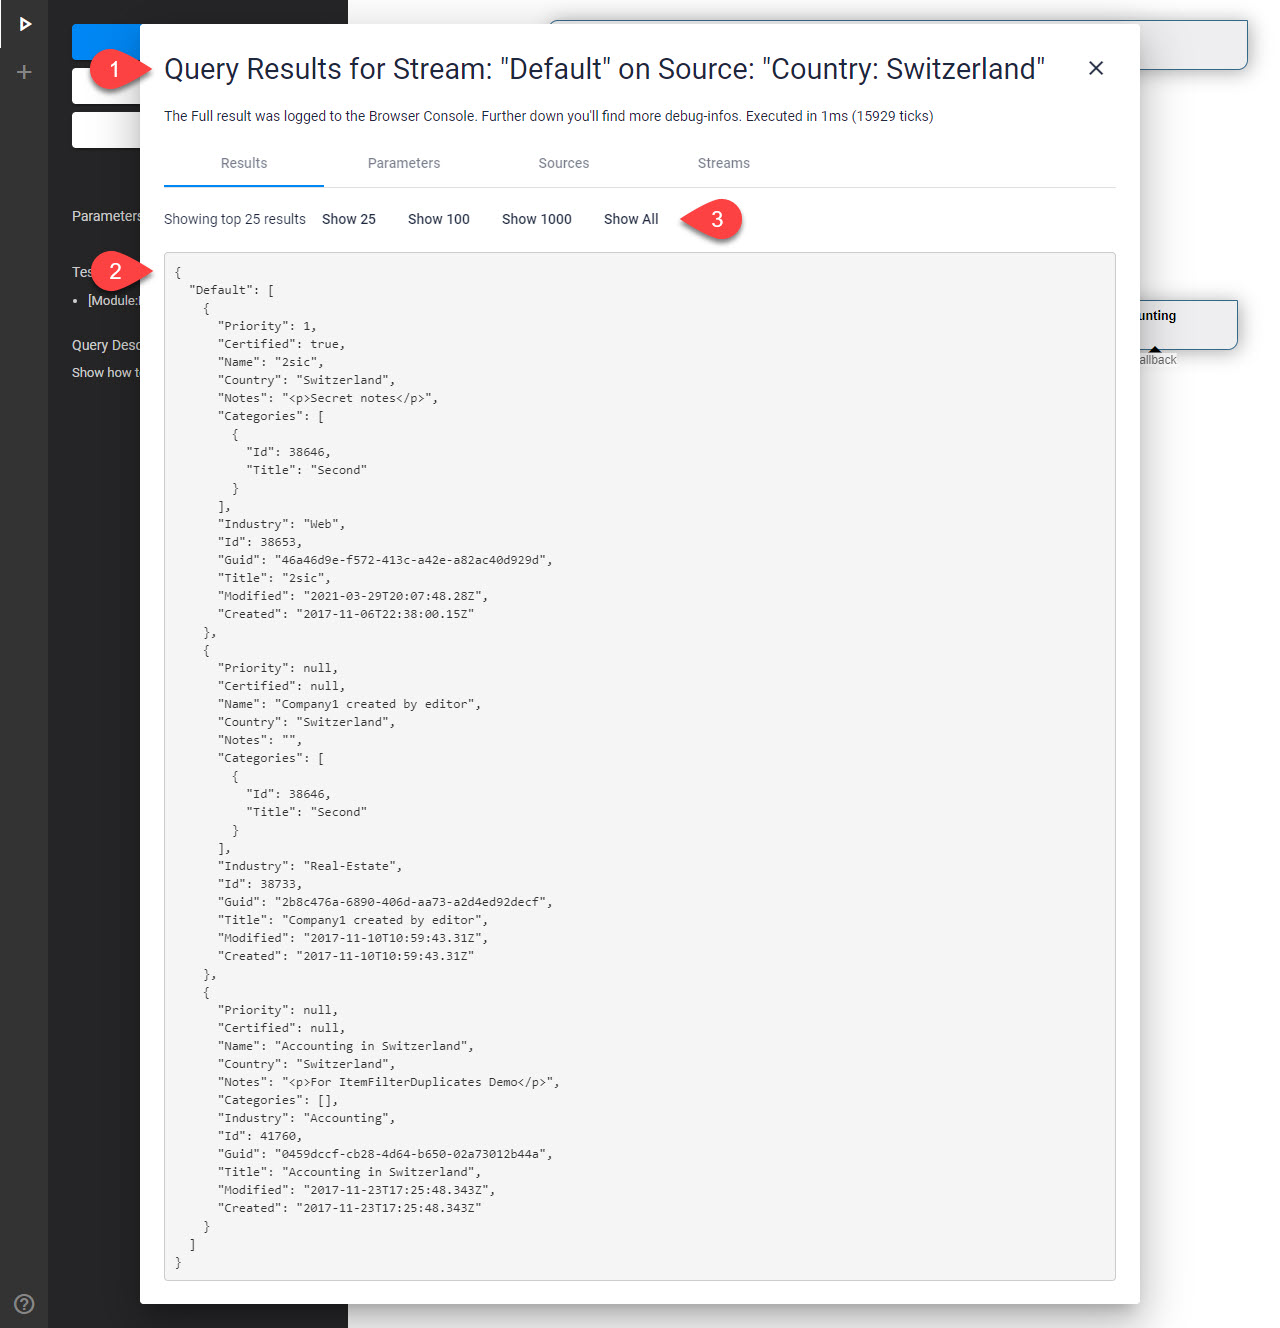
Note that in the image you see
- The title showing that you're looking at a stream
- The items in that stream
- An info that VisualQuery only picked the top 25 entries, but that you can re-run it with more results.
Non-Breaking Errors
Previously if there was an error in a Query, the entire query would fail and you would get a error message which was very difficult to debug.
Now the system is much simpler. If any Stream has an error it will actually still provide a single Entity containing the error information. This looks like this:
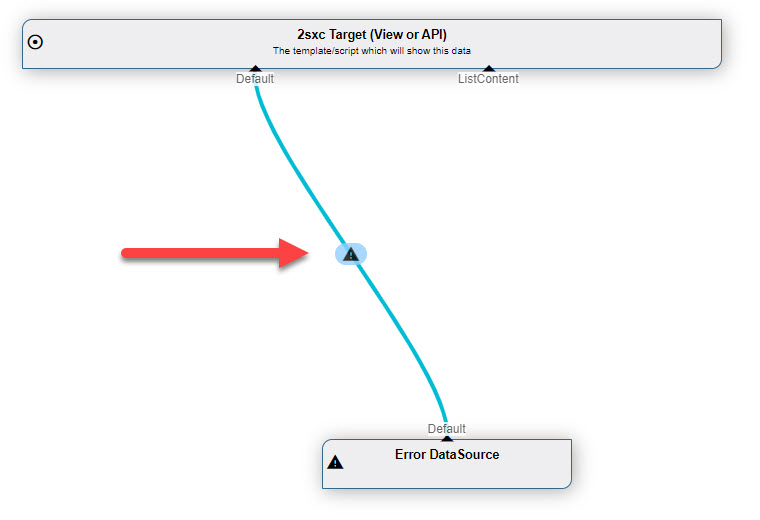
If you then click on the ⚠ you'll see the full message like this:
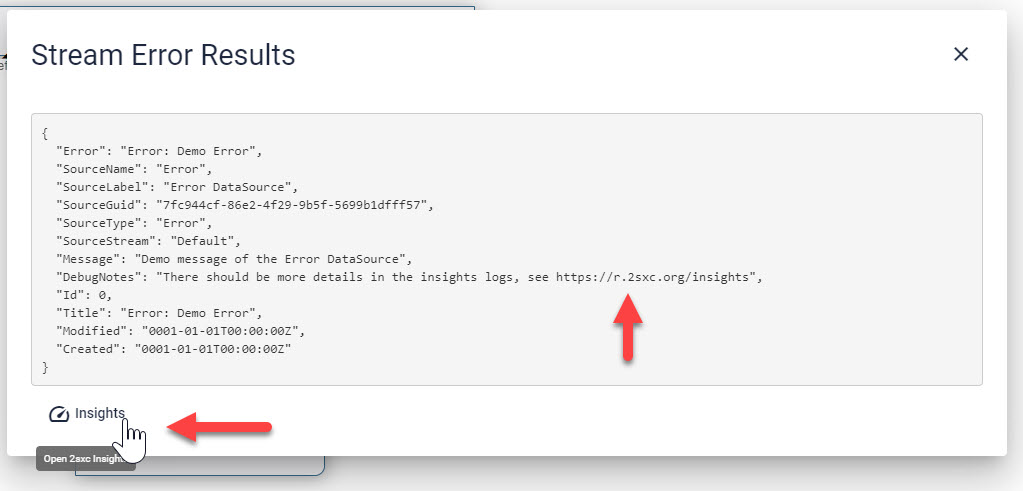
The button below will bring you to the 2sxc Insights...
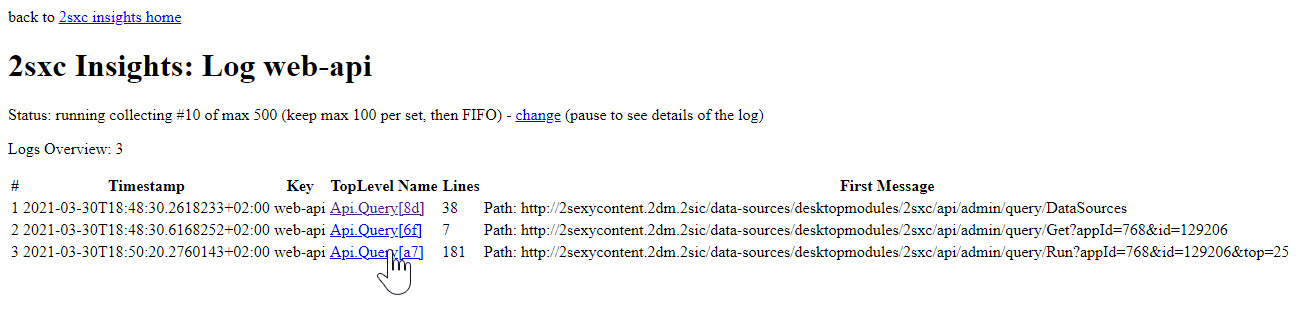
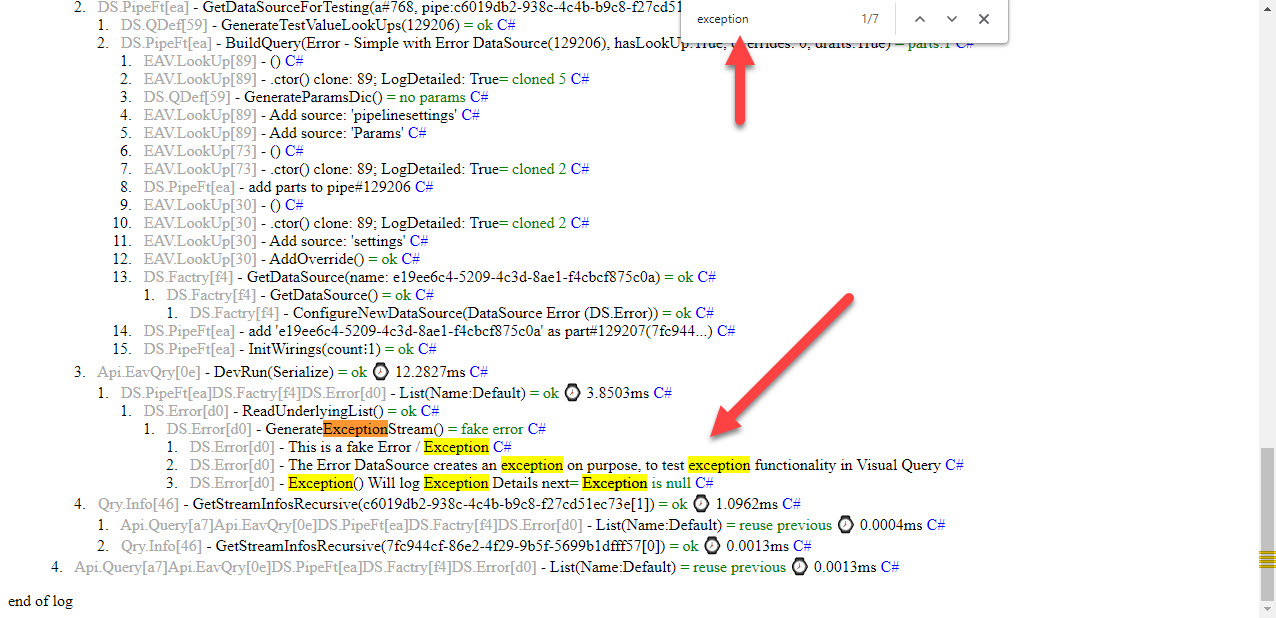
...where you can click on a request and search for Error or Exception to find out more:
Security Considerations
- All the error information is also logged into Insights, so super-users can check that for more details.
- If the query blows on a normal user, the data will not contain any important information - so no paths, no internal values, etc.
- If the query blows on the Super-User we'll sometimes include more information - like the Path to the CSV file
History
- Introduced in VisualQuery 3, 2sxc 11.13